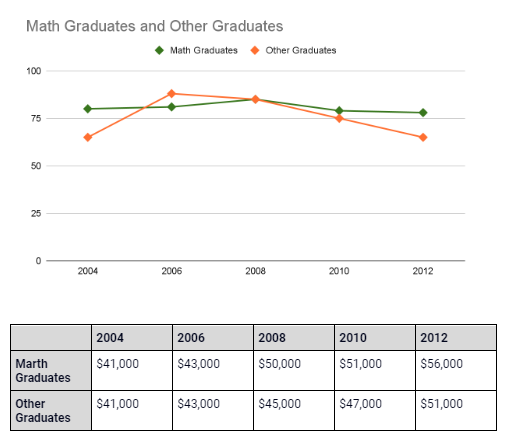
The graphs below show the percentage of graduates that got full-time jobs after graduating from a university in Australia, and the average salary of both these types of graduates, from 2004 to 2012. Summarise the information by selecting and reporting the main features, and make comparisons where relevant.
You should spend about 20 minutes on this task.
You should write at least 150 words.
All large companies should provide sports and community facilities to the local community. To what extent do you agree or disagree with this statement? Give reasons for your answer and include any relevant examples from your own knowledge or experience.
Give reasons for your answer and include any relevant examples from own knowledge or experience.
You should spend about 40 minutes on this task.
You should write at least 250 words.
Other modules in this test:
Comments:
Large companies usually employ a lot of local labor and have in many cases improved the employment rate in the communities where they are established, thereby improving the quality of life of the members of that community. Half the time this is where the benefit usually stops and in some cases the companies may end up producing harmful environmental wastes or having a rather exploitative or unfavorable working conditions which on the long run prove more harmful to the local community than all the benefits they produce.
When a company is first established, oftentimes it is difficult to know which would prove to be most beneficial or harmful on the long run, but whatever the case, activities that promote community building , team bonding, are helpful for both community and company and there seems to be no better way for both parties to get along than through healthy sporting competitions. It allows for there to be a bridging of th gap in many extents between employers and employees as well as improve the acceptance of the local indigenes of the community to the activities of the companies. Several companies may even take advantage of these events to market their products as well as leverage the opportunity to give back meaningfully to the community through incentives that may come in form of winning cash prices or scholarships from these sporting events.
I beleive it is important for Companies to support the local communities by providing more sports and community facilities to the local community based on this mutual need of both the companies and the community if they must both thrive. Since these large companies would ultimately need a buy-in from local participants as well as an assurance of their security while carrying out their activities in the said community it is only fair that the community benefits as well from the profits especially considering the potential hazards which may be faced from environmental pollution in a few cases.
Bearing in mind that often times environmental pollution is unintended and whereas I do not advocate for environmental pollution, It would seem however that , in the setting of the occurrence of detrimental environmental effects brought about by the activities of a certain company, the locals may be more forgiving if they have otherwise benefited from infrastructures, amenities, scholarships or other benefits and may be more cooperative in improving and finding more ecofriendly solutions as both parties try to forge ahead.
Therefore, I think Companies should always be deliberate in engaging with key community stakeholders, identifying their needs and seeking for areas that they can make their impacts felt locally as on the long run this has proven historically to be good for business.
The attached graph shows the number of films produced by five countries over a three year period spanning 2007 to 2009. The countries are depicted by the alphabets "A-E", while three colours are used to represent the different years with green, blue and yellow depicting productions in 2007, 2008 and 2009 respectively.
A critical view of the graph shows that Country A had the highest production of films among the 5 countries in the 3 years under review, maintaining its performance in the first 2 years but slightly dipping in the last year.
Country B also seemed to have a high number of films being produced but this was significantly lower than that produced by Country A, however, unlike the trend seen in Country A after maintaining same level of production for the first 2 years there was a significant improvement in the third year which is quite suggestive of improved efficiency of their processes.
Countries C, D and E when compared to the first two countries appear to be struggling in terms of film production and would greatly benefit from increased interactions with Countries A and B to learn and adopt best practices which have helped them continue to maintain high standards in terms of number of films produced yearly.
Apologies this is wrong this is what I meant to post
" The attached graph describes the percentage of graduates that got full-time jobs upon graduation from an Australian University as well as the average salaries earned by the said graduates from 2004 to 2012. It distinguishes math graduates from other graduates as well as shows a trend in the amount being paid to each. The math graduates are represented by a green line and the other graduates being represented by a yellow line. Years are charted on the horizontal axis against percentages on the vertical axis and compared with a table comparing their earnings per year in the different subcategories.
Critically analyzing the data, it would appear that In 2004, more math graduates were employed, with an average salary of $41,000 being paid to both subcategories, while in 2006 the picture changed with other graduates being employed more than their math counterparts. In 2008, however, the number of graduates employed was the same for both although there seemed to be a discrepancy in their earnings with the Math graduates earning $50,000 as opposed to the $45,000 being paid to other graduates. This picture would further change in 2010 and 2012 and seems to stabilize with the Math graduates being employed more and increasingly earning much more than the average salary of the others wth $51,000 and $56,000 being earned by the maths graduates in 2010 and 2012 respectively and $47,000 and $51,000 earned by the other graduates in both years as well.
In Conclusion though both professions seemed to start out at the same pay in 2004, Math would ultimately prove to become the higher paying profession on the long run when compared to others."